📈 Trends
The Trends section is the data-analytics environment of InForm.
It is designed to help users move beyond individual variant inspection and uncover patterns, relationships, and trade-offs across the full design space.
The Trends view is always accessible, but the individual analytics become available once:
- The design has been published, and
- At least 30 variants have been computed
What You Can Do in Trends
Trends provides four analytics tools, each suited to a different type of question:
- Regression – explore the relationship between inputs and outputs
- Sensitivity Analysis – identify which inputs have the greatest influence on a target output
- Pareto – visualise optimal trade-offs between competing objectives
- Bar Plot – compare the mean and spread of outputs across categorical values
Together, these tools help users move from raw variant data to meaningful design insights.
Regression
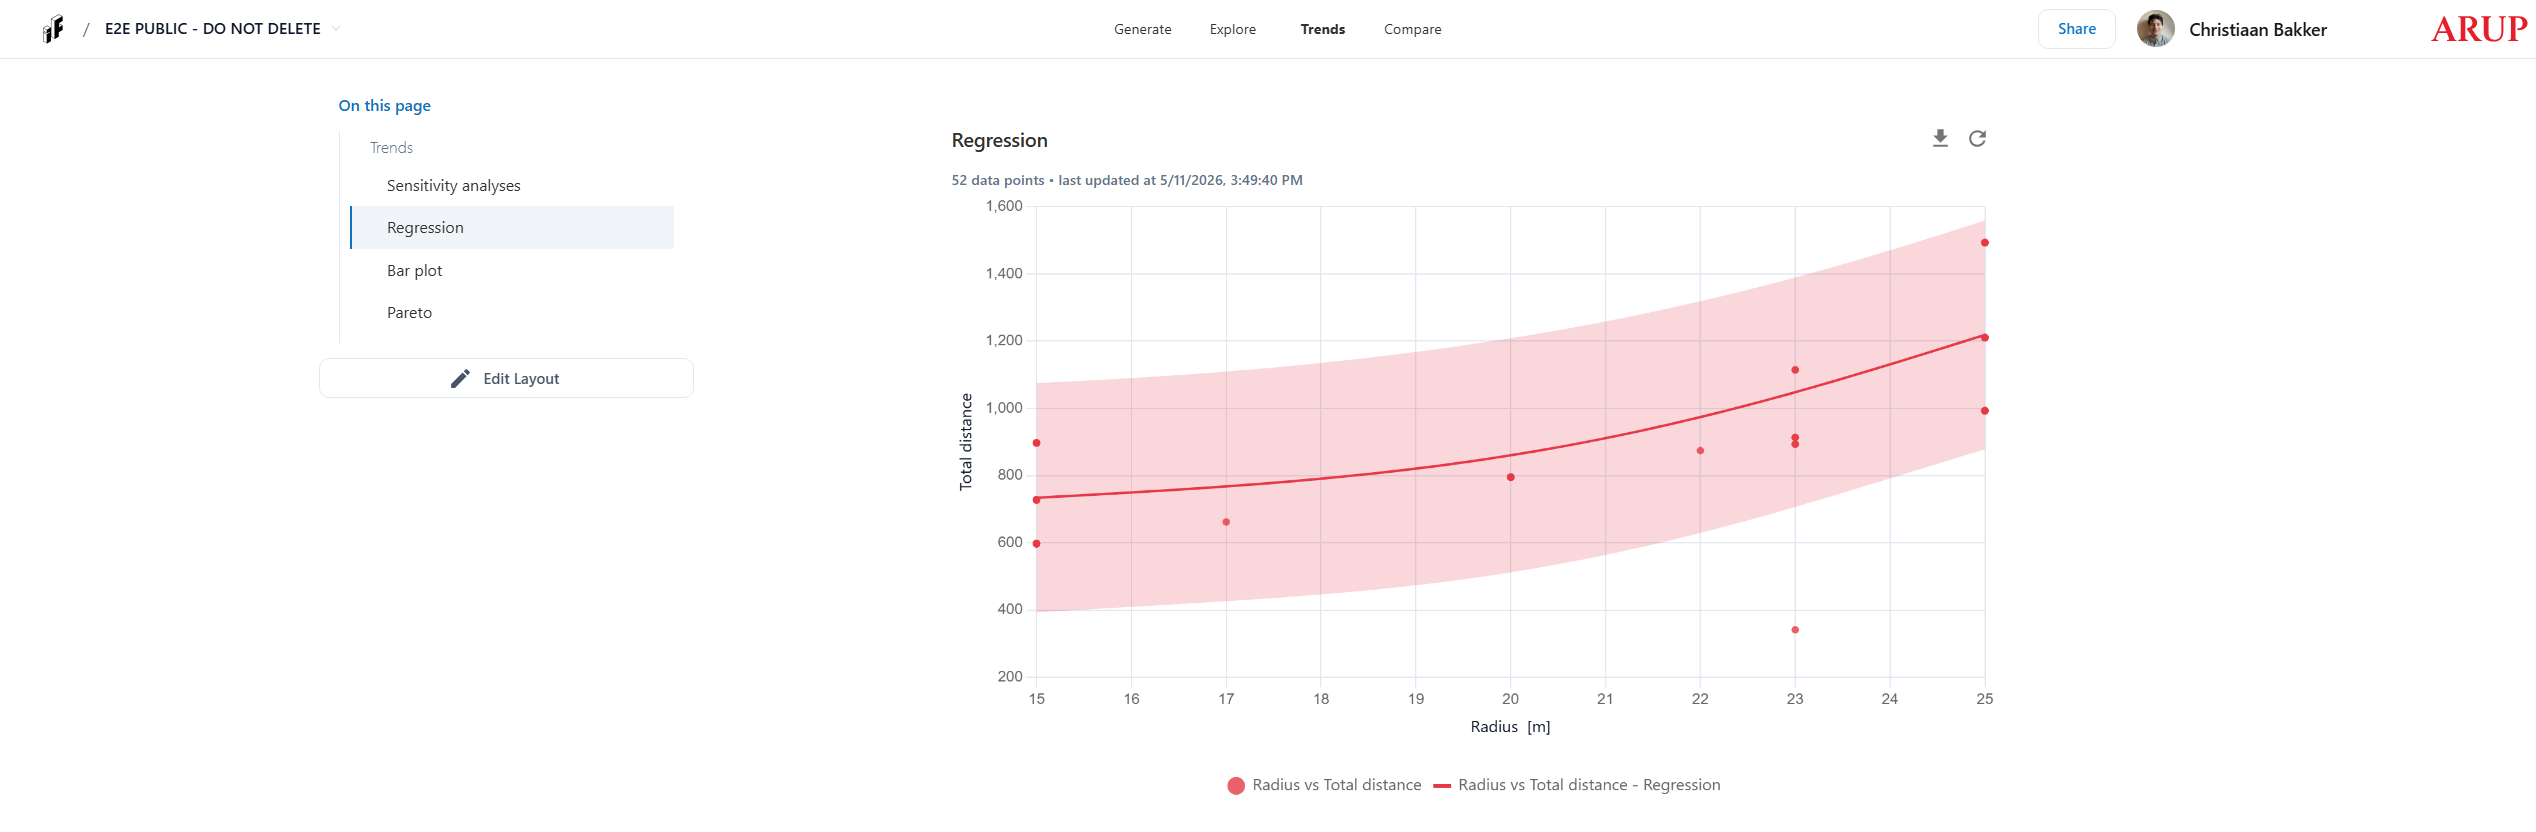
The Regression view plots the relationship between a selected input and a selected output across all computed variants.
This makes it possible to:
- Understand whether a design output increases or decreases as an input changes
- Spot non-linear behaviour or unexpected patterns
- Build intuition about how the model responds to changes
Regression is particularly useful early in the analysis process, to quickly sense-check how the model behaves before narrowing the design space.
Sensitivity Analysis
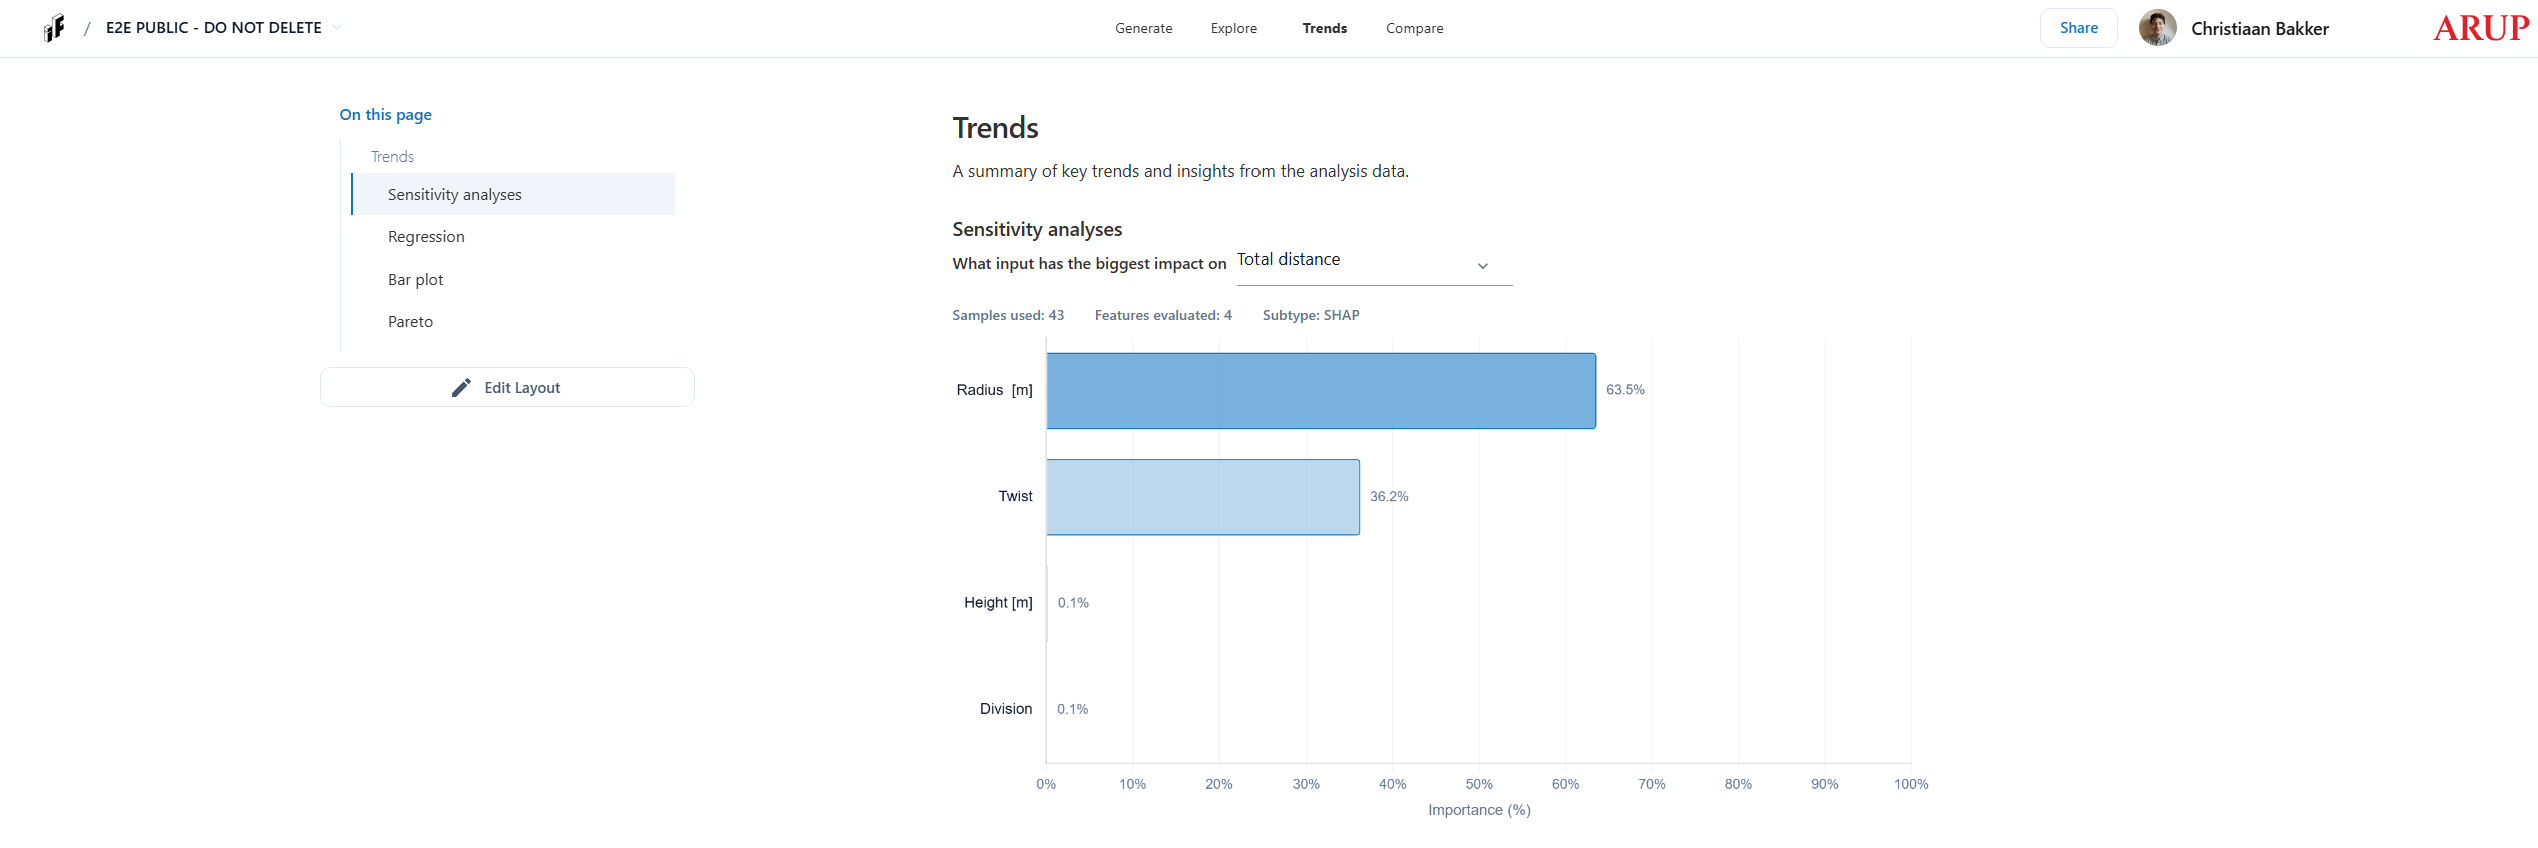
The Sensitivity Analysis view shows which input parameters have the greatest influence on a selected target output.
Results are expressed as percentages, indicating each input's relative contribution to the variation in the chosen output.
This makes it possible to:
- Identify which design levers matter most
- Deprioritise inputs with little impact on performance
- Focus optioneering efforts on the parameters that drive results
Sensitivity analysis is especially valuable when working with many inputs, helping to simplify the design space and focus attention where it counts.
InForm uses SHAP (SHapley Additive exPlanations) to calculate sensitivity values.
Pareto
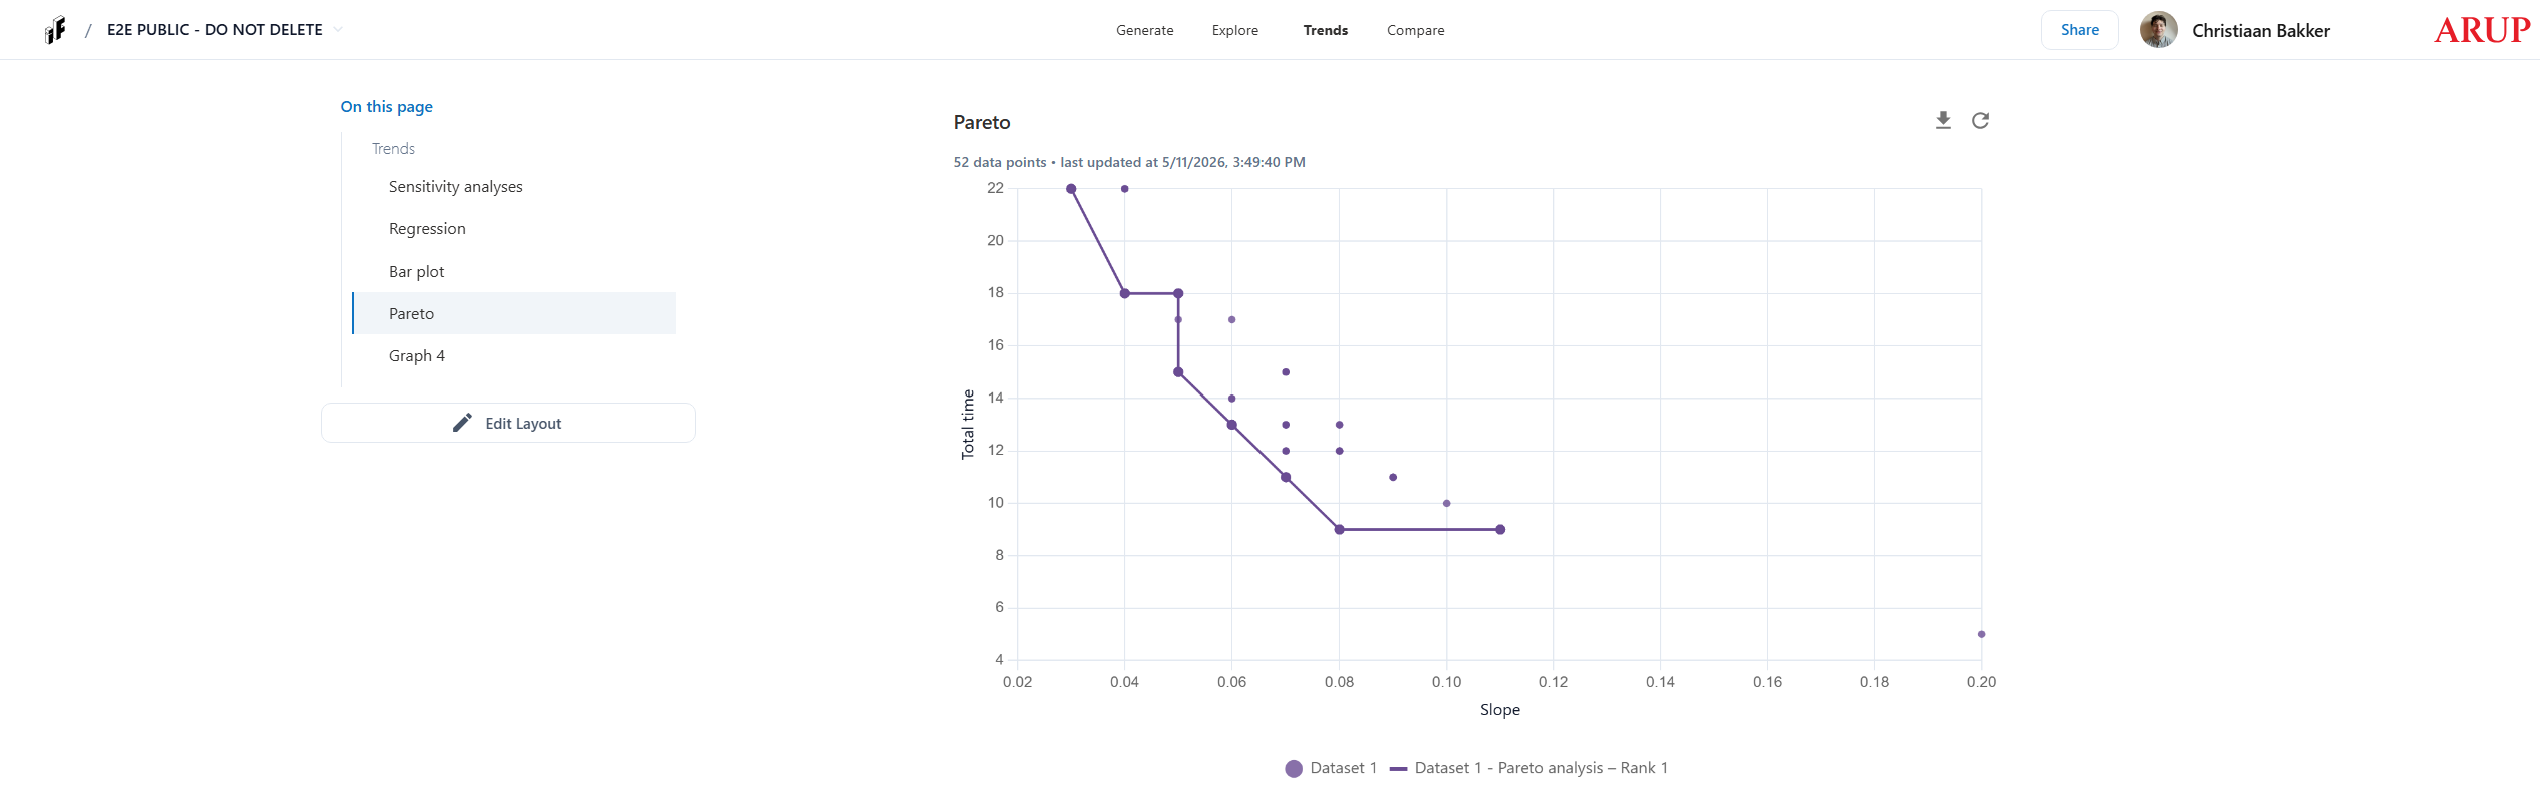
The Pareto view identifies variants that represent the best achievable trade-offs between two competing objectives.
The Pareto front shows the set of designs where improving one objective is only possible at the cost of the other — the boundary of optimal performance.
This makes it possible to:
- Understand the fundamental tension between two outputs (e.g. cost vs. carbon)
- Identify which variants sit on the performance frontier
- Avoid selecting options that are clearly outperformed by alternatives
Pareto analysis is particularly useful when decision-making involves competing priorities that cannot all be optimised simultaneously.
Bar Plot
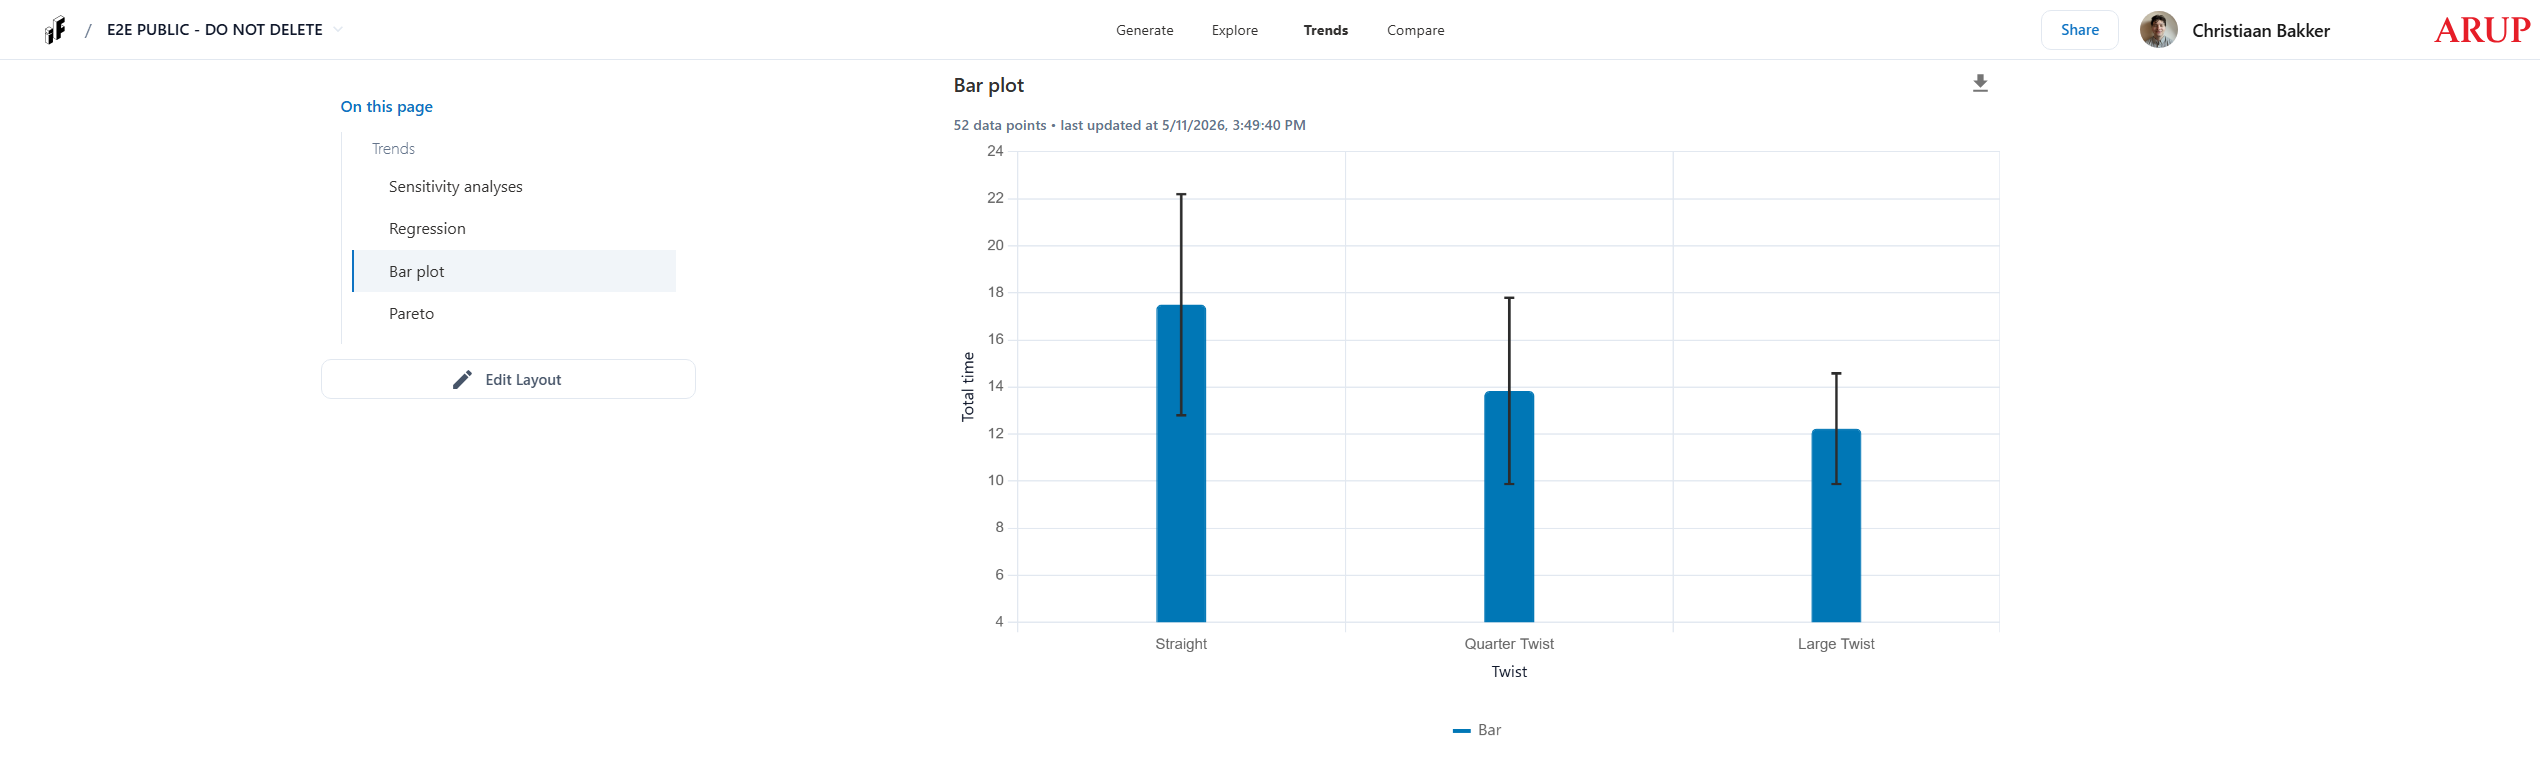
The Bar Plot view summarises the mean and standard deviation of a selected output across a categorical input or grouping.
This makes it possible to:
- Compare average performance between design categories or discrete options
- Understand how consistent or variable performance is within each group
- Identify which categories reliably outperform others
Bar plots are well suited for inputs with a limited number of distinct values, where comparing central tendency and spread provides more insight than examining individual variants.