Axis Settings (AS)
Configure axis properties for InForm charts, including title, scale type, ranges, tick options, and stacking behaviour.
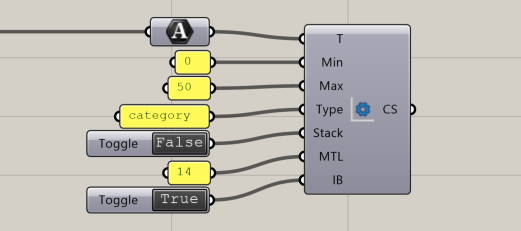
📸 Component Screenshot
���📂 Component Location
Tab: 3. Charts
📝 Description
The Axis Settings (AS) component defines configuration parameters for chart axes. It supports setting titles, min/max limits, scale types (category, linear, time), tick density, stacking, and boundary inclusion.
These settings are applied to X or Y axes within the Assemble Chart (AC) component.
📁 Example File
🔌 Inputs
| Abbrev. | Full Name | Type | Description |
|---|---|---|---|
| T | Title | Text | Axis title. |
| Min | Min | Number | Minimum axis value. |
| Max | Max | Number | Maximum axis value. |
| Type | Type | Text | Scale type: "category", "linear", or "time". |
| Stack | Stacked | Boolean | Enables stacked-axis behaviour. |
| MTL | Max Ticks Limit | Integer | Maximum number of tick marks. |
| IB | Include Bounds | Boolean | Whether to include boundary values in ticks. |
🔄 Outputs
| Abbrev. | Full Name | Type | Description | Suggested Connections |
|---|---|---|---|---|
| Set | Chart Settings | InForm data | Axis configuration for charts. | Connect to Assemble Chart (AC) (3. Charts) to control X or Y axis behaviour. |