Doughnut Chart (DC)
Generate a doughnut chart for visualization in the InForm web platform.
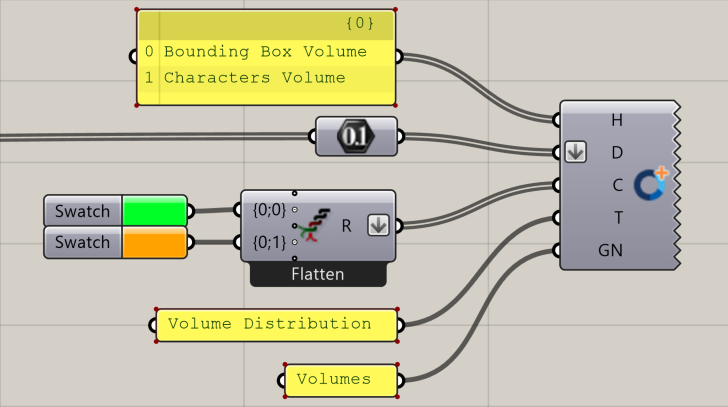
📸 Component Screenshot
📂 Component Location
Tab: 3. Charts
📝 Description
The Doughnut Chart (DC) component creates a multi-segment doughnut chart using lists of labels, values, and optional colours. Labels appear in the legend and tooltips, while colours can be user-defined or fallback to default Arup colour palette.
📁 Example File
🔌 Inputs
| Abbrev. | Full Name | Type | Description |
|---|---|---|---|
| H | Headers | Text | List of labels for each segment, shown in the legend and tooltips. |
| D | Data | Number | List of numeric values. Each entry defines the size of a doughnut segment. |
| C | Colours | GH Colour | Optional list of RGB colours. If absent, InForm uses Arup default colour set. |
| T | Title | Text | Title displayed for the chart. |
| GN | Group Name | Text | Identifier used to group charts under shared categories in InForm. |
🔄 Outputs
This component has no outputs.
Once inputs are connected, the doughnut chart is automatically displayed in the InForm platform.